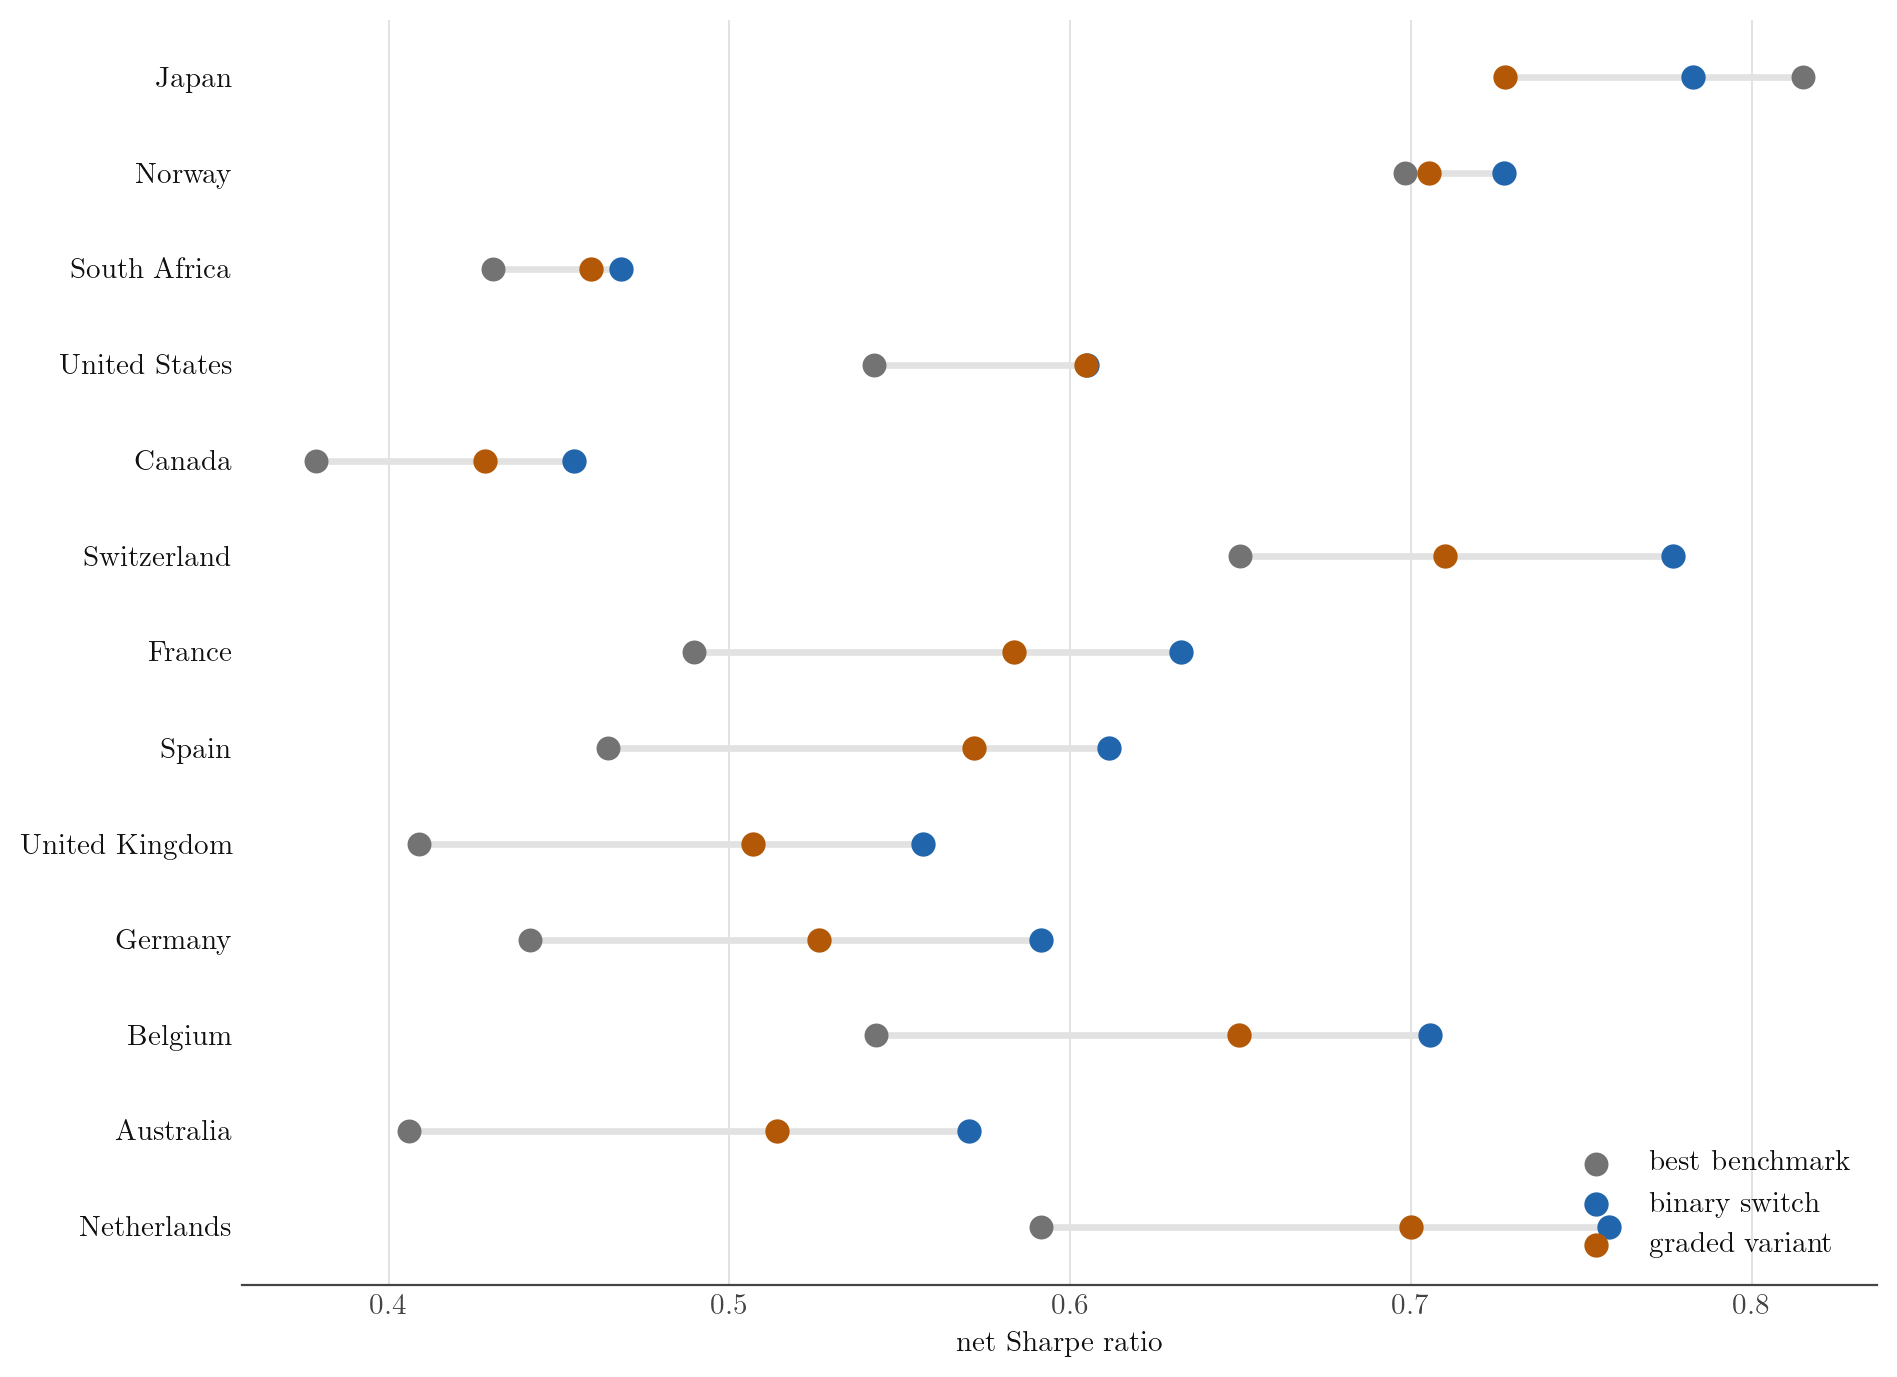
The "four quadrants" framework, common among practitioners, allocates wealth across four macroeconomic states defined by two market-price signals: an energy axis, and a monetary axis. We test the two axes separately on thirteen markets estimated together, including the United States, pooling 6,264 market-months (5,796 in the risk-adjusted panel). Three results emerge. First, the monetary axis survives: a rule holding government bonds when the local bond-gold ratio exceeds its seven-year mean, and gold otherwise, beats the better of two static benchmarks in twelve of thirteen markets, with a median net Sharpe advantage of +0.143. The risk-adjusted pooled estimate is +0.086 in annualized Sharpe (Driscoll–Kraay covariance at twelve lags), significant at the one-sided 10 percent level, not at 5 (p = 0.059); it remains positive after removing the United States but becomes marginal in the narrowest cut of seven markets. Second, replacing the fixed bond pocket with a pocket of listed energy equities lowers the net Sharpe in eleven of thirteen markets, by a median of −0.107. Third, the form of the surviving rule is binary: the graded variant loses Sharpe in all thirteen markets. The framework thus reduces to a single-axis switch, binary and monetary. No average return gain is identified against the binding benchmark, but volatility remains about half that of a 60/40. Beyond allocation, these results reduce a widespread practitioner framework to a single monetary switch, read as the relative price of the trust placed in the currency.
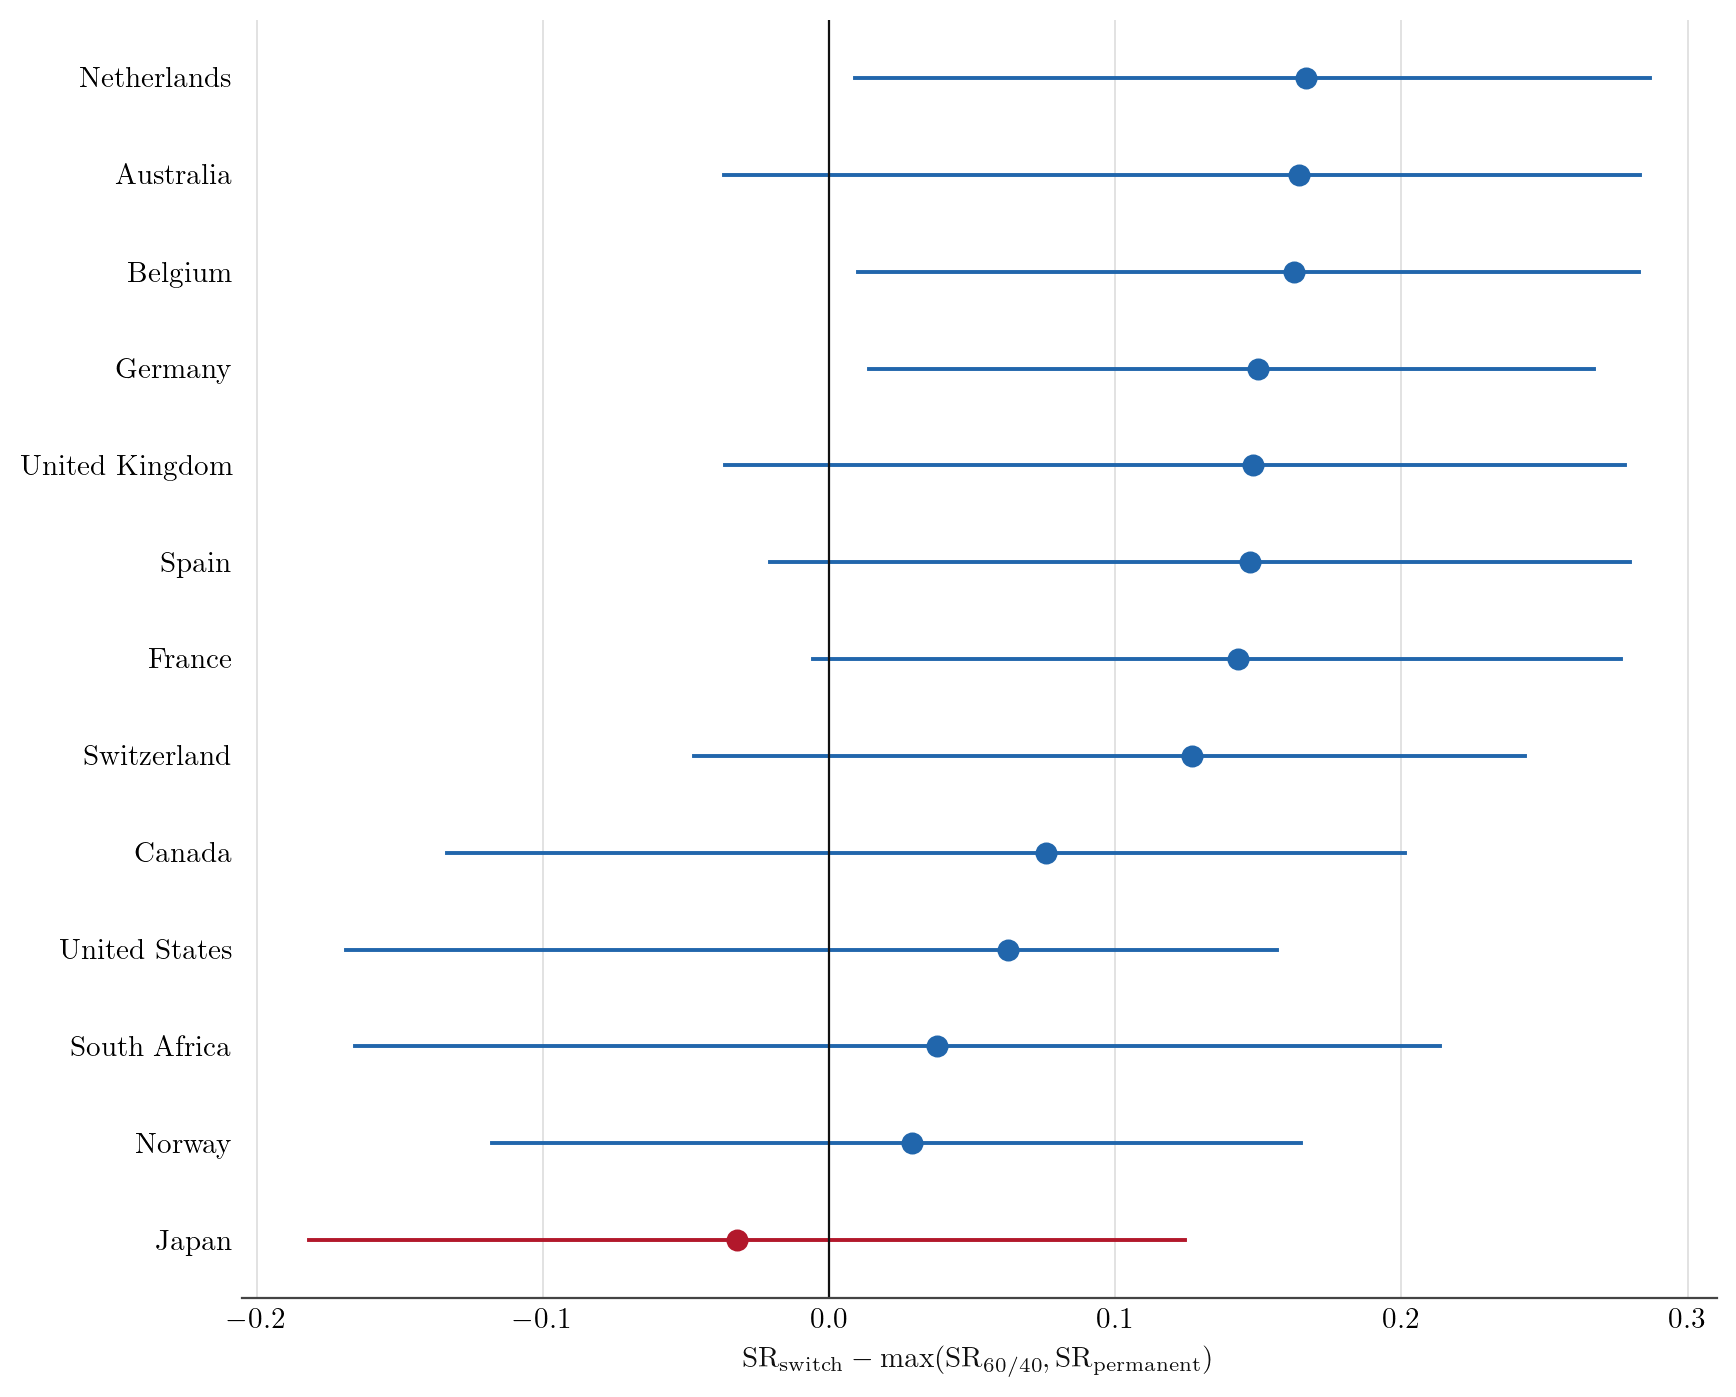
per-market Sharpe advantage vs the harder benchmark
Figures
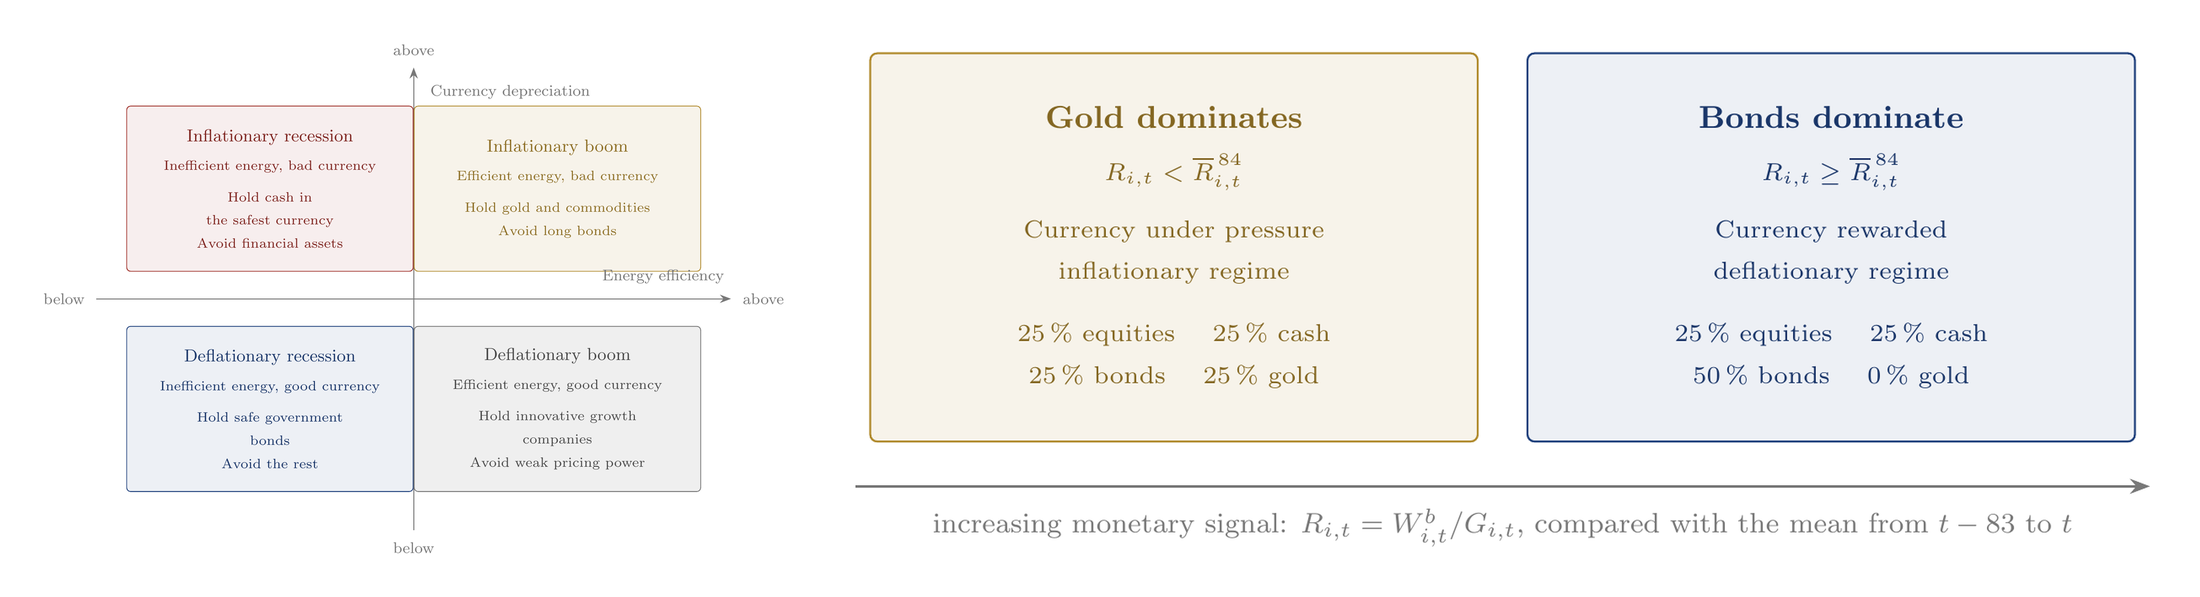
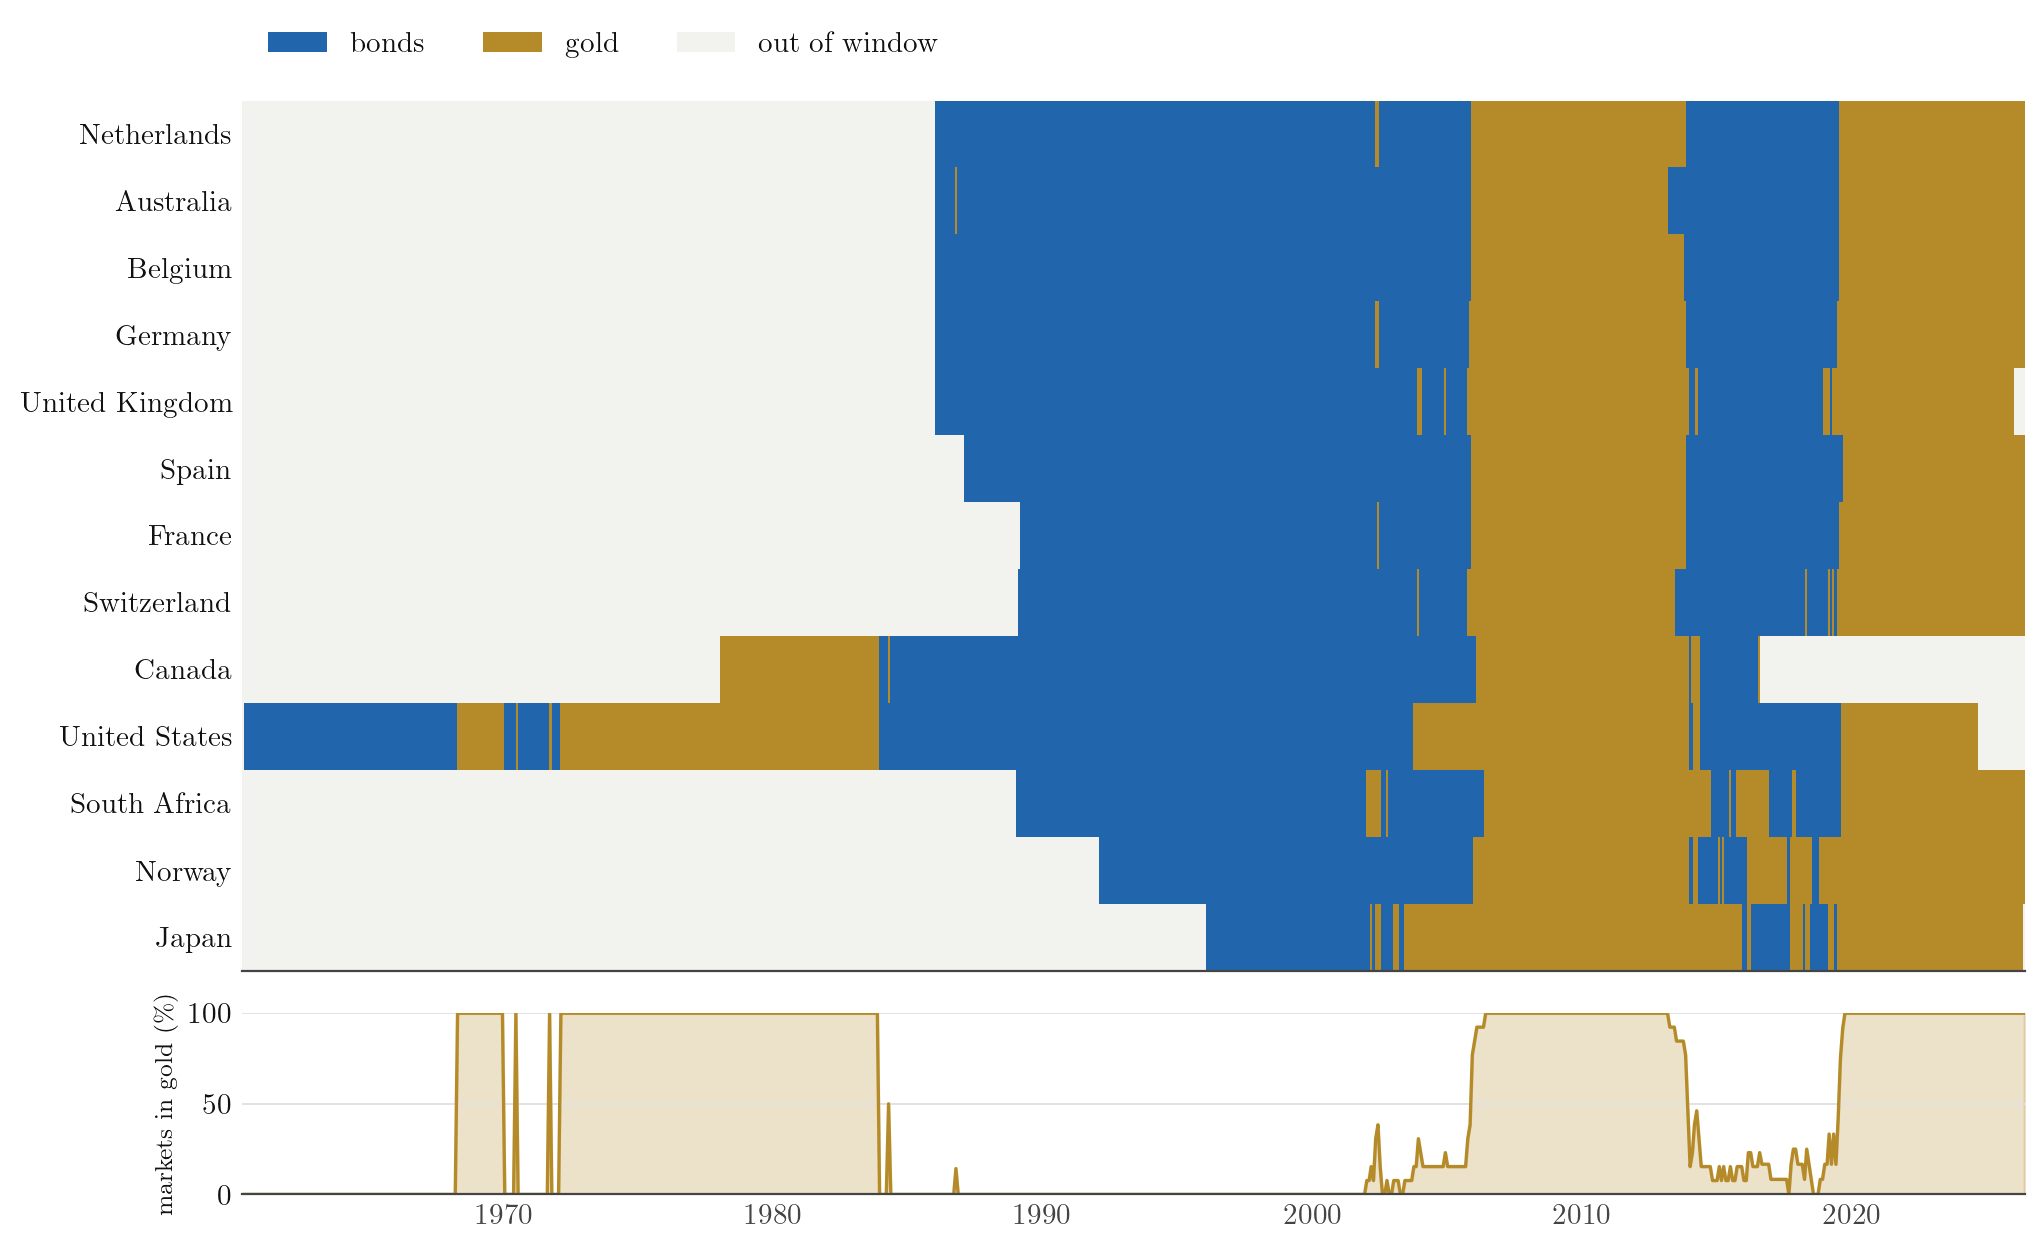
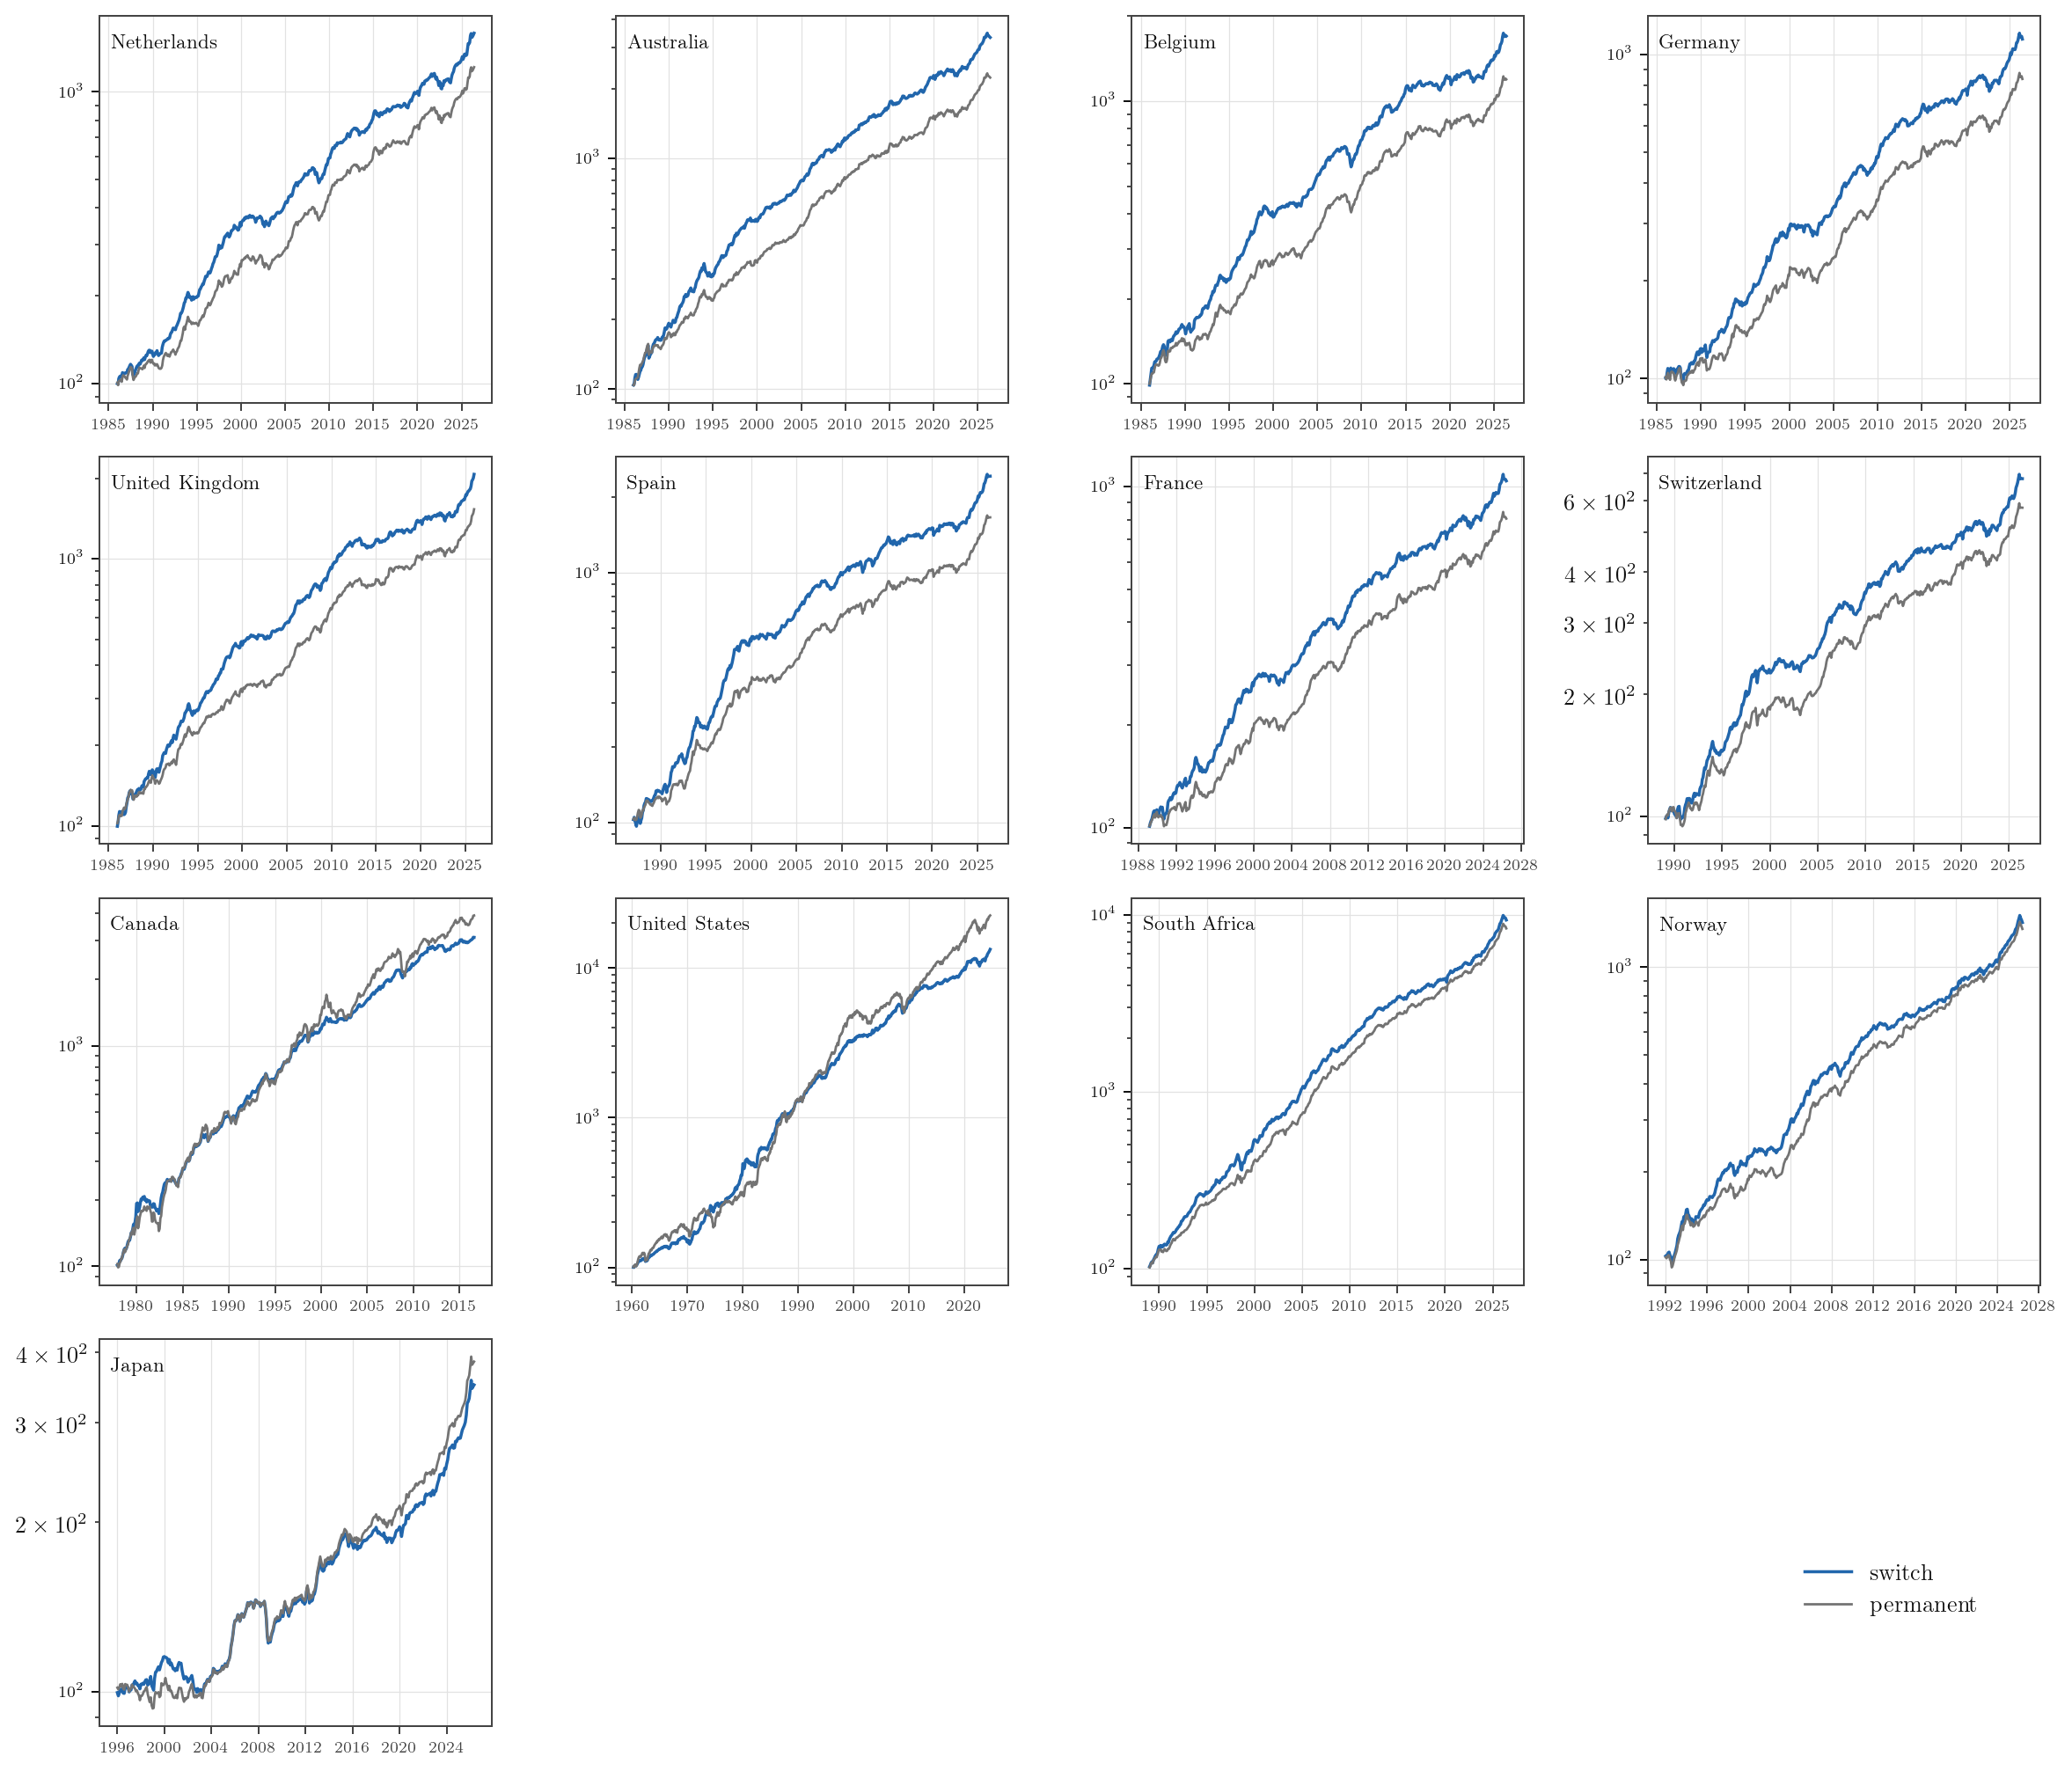
Fig 1. The four-quadrant framework and its reduction. Panel A (left): the practitioner construction — two market-price axes, energy efficiency and currency depreciation, partition the space into four macroeconomic states. Panel B (right): the two monetary states that survive the decomposition — gold dominates (currency under pressure, inflationary) versus bonds dominate (currency rewarded, deflationary) — read from the bond–gold signal R against its seven-year mean.Fig 2. The bond–gold signal across markets and over time.Fig 3. The hypothesis ladder — the nested rules tested, from the full two-axis framework down to the surviving single-axis monetary switch.Fig 4. The advantage by market, with uncertainty: the monetary rule beats the harder static benchmark in twelve of thirteen markets.Fig 5. Wealth trajectories of the switch and its benchmark, thirteen markets — cumulative wealth (log scale, base 100, net of costs) for the binary switch against each market’s binding benchmark. The switch compounds more than its benchmark in ten of thirteen markets, delivering a comparable terminal wealth to the 60/40 by a markedly smoother path; the lead was largely acquired before 2000 and partially eroded since.
Full paper
This is a working paper. The full PDF is available on request — the replication code is public on GitHub.